
The M2 money supply rose at an unprecedented pace in the two years following the covid pandemic. In the last year, that same M2 money supply has fallen at a rate not seen since the 1930s. In this post, we explain why the rise and subsequent fall in M2 makes a recession likely.
What is the Money Supply
The M2 money supply is the most widely followed measure of the supply of money. M2 is defined[1] as the sum of the following:
- Currency
- Bank Deposits including:
- Demand deposits
- Other liquid deposits
- Savings deposits
- Small denomination time-deposits (excluding retirement accounts)
- Money market funds
What Defines a Recession
In common parlance, a recession occurs when the economy shrinks instead of growing. A widely cited official definition[2] of a recession is two consecutive quarters of negative economic growth.[3]
What Defines Gross Domestic Product (GDP)
Economic growth, in turn, is widely understood as change in the Gross Domestic Product, or GDP. The Bureau of Economic Affairs (BEA) says that GDP is “The value of the goods and services produced in the United States.”
Strictly speaking, this definition is nonsense, because value is not measurable. When you buy a hamburger for $8, by definition you must value the burger more than the $8, or you wouldn’t give up your $8 for the burger. Similarly, the seller must value the burger at less than $8, or the seller wouldn’t sell. Eight dollars is not the value of the burger—the value of the burger is not measurable. However, $8 is the market value of the burger. The two concepts are different.[4]
What the BEA means is that the GDP market value of the goods and services produced and sold in the United States. If all transactions in the economy were voluntary, as when you chose to buy, or not buy, a burger, the GDP would represent a valid estimate of the lower bound of value, in dollars, generated by the economy.
Is War Actually “Good for the Economy”?
However, GDP also counts the market value of government expenditures. If you took a course in macro-economics in college, chances are you learned that GDP is the sum of:
- Consumption,
- Investment and
- Government Spending (adjusted for net exports)
Government spending is included in GDP because John Maynard Keynes[5] persuaded the British Government to include it, so that the massive war spending would show that the economy was doing better. The US and the world adopted that definition.
Thus, the official statistics show that the US economy grew dramatically during WWII, even though most people in the US (and the world) were significantly worse off from a material perspective, even if their lives were not being threatened or ended. Food was rationed. Gasoline was rationed. Tires were rationed. New cars and appliances were not available. New homes were rare (except as part of military or related housing).
Even ignoring the immense human cost to the US[6] of WWII (approximately 405,000 soldiers were killed, another 670,000 were wounded, and over 73,000 were declared missing and have never been found), people were not as a rule better off economically by 1945, despite the official GDP nearly doubling.
I am not arguing that the US should not have fought WWII. Almost certainly fighting the war was the less-bad alternative. But it is absurd to argue, as the GDP growth would, that the war made people better off. After the war ended, and production could be directed toward producing things that people voluntarily bought – including cars, homes and foods such as steak, butter and eggs – people (who had survived unscathed) were certainly better off on average than they had been during the war. Yet the GDP (adjusted for inflation) shrank in 1946 because government spending fell from its WWII levels.
One problem with GDP as a measure of economic well-being is that it includes involuntary transactions – those represented by government spending – and counts them the same as voluntary purchases, sales and investments. Involuntary transactions — for example taxes — create what economists call deadweight losses[7], which are, by definition, value-destroying.
Nevertheless, despite, or perhaps because, GDP includes government spending, politicians and policy makers place tremendous emphasis on GDP.
The Math of Money Supply and GDP
In theory, the GDP is calculated by adding up the product of quantity of every purchase times the price of the purchase. For example, suppose an economy consisted only of hamburgers and fries. If 100 burgers were sold at $8 each, and 50 fries were sold at $4 each, the GDP of this little economy would be $800 + $200 = $1000.
It follows as a matter of mathematical logic that if prices rise and quantities remain the same, the calculated GDP number will grow. By the same logic, if prices fall, everything else equal GDP will fall.
Economists take these price effects into account by adjusting GDP for inflation. The inflation-adjusted GDP is called the real GDP.
It is extremely well established in both theory and history, that inflation is mostly a function of growth of the supply of money. (Ask us for a free copy of The Theory of Inflation, a chapter from our book Politicians Spend, We Pay.) It is also well understood that inflation has distorting effects that tend to cause a jump in economic activity while money is entering the system, and that those effects reverse, causing a contraction of economic activity.[8]
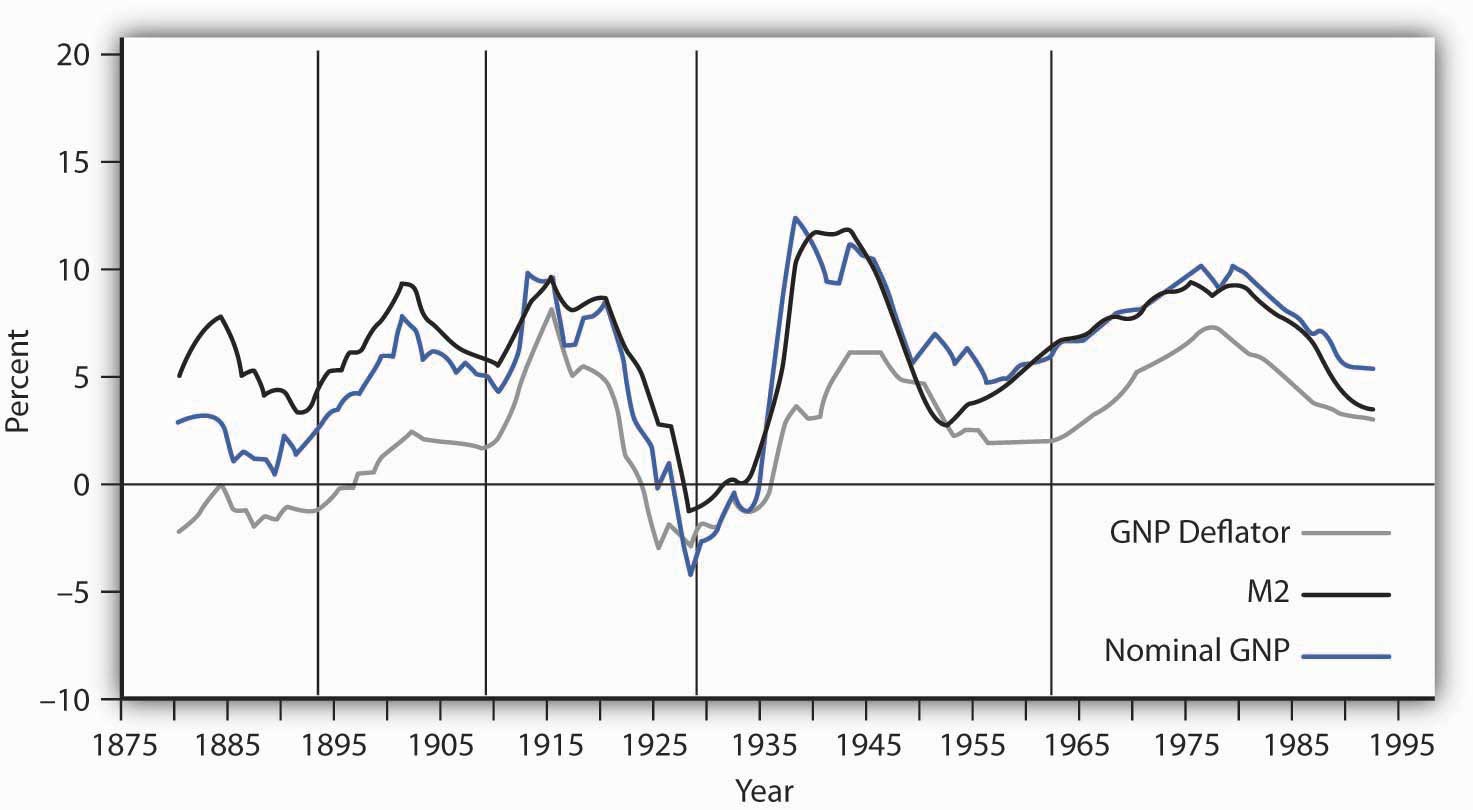
Here is the last four decades of the relationship between M2 and nominal GDP:

This graph shows the historical empirical relationship between the rates of change of M2 and nominal GNP for about 120 years to about 2000.[9]

The connection between nominal (not inflation-adjusted) GDP is clear. More M2 growth almost by definition means more nominal GDP growth. This relationship is not only not surprising, it is essentially a consequence of the definition of GDP.
Inflation Adjustments
The connection between money growth and inflation is tight, though with lags. The fact that the new money enters the economy before prices have a chance to rise creates the appearance of a boom, because buyers have more money and they use that money to buy more goods and services.
Similarly, when the supply of money shrinks, everything else equal, buyers have less money and buy fewer goods and services.
But “economic growth” that results only from a rising money supply isn’t real growth. Real growth is the growth after adjusting for the fact that rising money supply causes inflation.
Both economic activity and inflation result from changes in the money supply, and both do so with lags. However, the aggregated GDP, representing “the economy”, is the result of the actions of hundreds of millions of individuals making billions of decisions. Thus, even though we know the gross effects of huge changes in the money supply, it is not possible to predict accurately how long the lags will be, or exactly how big the effects will be.
Nevertheless, for the reasons outlined above, we believe that the huge growth in M2 from 2020 to 2022, followed by the biggest drop in M2 since the 1930s, will result in a recession, and based on historical lags, probably within a year or so.
If you are concerned about potential recession, and have clients with appreciated real estate, a concentrated stock position, a business holding, or some other capital asset that you’d like to help them “take off the table” in a tax efficient manner, please ask us for a free copy of one our Advisor Guides. Click here to ask for a copy of our Advisor Guide to Selling a Business, Advisor Guide to Appreciated Real Estate, or Advisor Guide to Stock Diversification. Or call 703 437 9720 and ask for Connor or Katherine, or email us at [email protected].
Best,
Roger
[1] This is a simplified version of the Fed’s full definition, which can be found here: https://www.federalreserve.gov/releases/h6/current/default.htm
[2] https://www.bea.gov/help/glossary/recession
[3] For more than you probably ever want to know about recessions, see What is a Recession? https://www.nber.org/system/files/chapters/c0687/c0687.pdf
[4] The modern theory of value was first spelled out in detail by Carl Menger in his 1871 book Principles of Economics, chapter III, The Theory of Value, available free at https://mises.org/library/principles-economics
[5] John Maynard Keynes, How to Pay for the War : A Radical Plan for the Chancellor of the Exchequer. London: Macmillan and Co., Limited,
[6] The cost to the US, as great as it was, was a small fraction of the total battle deaths of WWII, estimated at 15 million, with 25 million wounded. In addition, an estimated 45 million civilians lost their lives, including 6 million Jews murdered by the Nazis.
[7] See, for example, this article explaining and illustrating the concept of deadweight losses: https://www.econlib.org/archives/2017/02/taxes_and_deadw.html#:~:text=The%20deadweight%20loss%20from%20a,does%20not%20elaborate%20on%20this.)
[8] The theoretical analysis goes back to 1755 and the work of the Frenchman Richard Cantillon. Richard Cantillon, Essai sur la Nature du Commerce en Général, translated and edited by Henry Higgs, London: Cass, 1931. Ask for a copy of Chapter 14 of Politicians Spend explaining the Cantillon Effect.
[9] Source: 808ded9deacf14ba8f5c62dc6331b55c.jpg (1473×810) (umn.edu); The US switched from reporting GNP to GDP in 1991. See https://apps.bea.gov/scb/issues/2021/03-march/0321-reprint-gnp.htm . For understanding the gross economic activity in a country like the US, GNP is essentially the same as GDP.
Leave a Reply